Tuesday, February 5, 2013

Databank highlighted in EOS issue 5th Feb

A brief communication in EOS appeared today outlining the databank available from http://onlinelibrary.wiley.com/doi/10.1002/2013EO060002/abstract*. The piece is by Jay Lawrimore who heads the task team, Jared Rennie who has done the bulk of the work and myself as a quasi-passenger to the whole enterprise.

This seems an apposite time to update on where we stand vis-a-vis a full first version release. We have done a first blacklisting sweep and are going back for a second try based upon what we learned to see whether we can catch any more issues.

The in-house development version that is a modification of beta 2 now stands at just over 32,500 stations. We have removed 'Atlantis' stations and resolved a large number of issues over wrong geolocation. We almost certainly won't have caught them all at whatever point we release - that's inevitable. But we are increasingly confident we'll have resolved the truly low-hanging fruit issues.

At the same time we have been revising the longer methods paper that Jared is leading based upon author feedback and to reflect the blacklisting. We plan to submit that to the journal soon.

Bottom line is that we are currently shooting for a release of version 1  of the databank mid-to-late March after necessary approval procedures have been followed in mid-March. Of course, that schedule is subject to change if we find any additional issues in the interim.

* The actual paper, for now, is behind a paywall. We will investigate whether we can post a copy and if so will provide a link to such an unrestricted copy in an update to this post.

Monday, January 28, 2013

More on efforts at data rescue and digitization - reposted press release

Note: This is a copy of a press release by two sister organizations, ACRE and IEDRO that I am reposting for them upon request. Please send further requests to the named contacts. Peter


Contact: Malia Murray
Cell: 301.938.9894

ACRE AND IEDRO SIGN MoU TO WORK TOWARDS DIGITIZATION AND ARCHIVING OF THE WORLD’S AT-RISK WEATHER AND CLIMATE DATA
The two independent organizations agree to work together for the digital preservation of and access to global historical weather and climate data through international data rescue, and digitization efforts as well as undertake and facilitate the recovery of historical, instrumental, surface terrestrial, and marine global weather observations.

   November 26, 2012 – Toulouse, France- Over fifty international climate, social and humanities scientists and representatives from the archival and library communities with common interests in climate services, gathered at Météo-France for the 5th Atmospheric Circulation Reconstructions over the Earth (ACRE) Workshop from the 28th-30th November 2012.  There they witnessed the signing of the Memorandum of Understanding (MoU) that will join efforts within the global climate services industry. The 18th session of the Conference of the Parties to the United Nations Framework Convention on Climate Change (UNFCCC) and the 8th Session of the Conference of the Parties serving as the Meeting of the Parties to the Kyoto Protocol were meeting simultaneously at the Qatar National Convention Centre in Doha, Qatar.

   This agreement forms the foundation of the User Interface Platform (UIP), the pillar of the World Meteorological Organization (WMO), and Global Framework for Climate Services (GFCS). The partnership unites the highest caliber of international experience and resources to ensure the finest of climate services. The partnership specifically enhances the areas of data rescue (DARE), the establishment of an International Data Rescue (I-DARE) Inventory, and identification of high priority weather and climate datasets. This arrangement also opens opportunities for collaborative funding of vital historical and contemporary weather and climate data. This is essential to the provision of, and access to, climate services.

    Together the ACRE and IEDRO communities, and their various partners, will develop the largest single source of primary weather and climate services. This will create opportunities to access long records of weather data that will be available for the full range of analyses. Dr. Rob Allan, International ACRE Project Manager, “The merger of ACRE and IEDRO under a new MoU is a major step towards building the infrastructure and funding support needed to reinvigorate and sustain international data rescue activities.  It will create a platform for wider partnerships with the global community and encourage funders to see the potential value in long, historical databases of global weather for use by the climate science and applications community, policy and decision makers, educators, students and the wider public.

  The resulting climate services data will contribute high quality, high resolution, weather and climate data available through free and open exchange via the National Oceanic and Atmospheric Administration (NOAA), International Comprehensive Ocean-Atmosphere Data Set (ICOADS), the International Surface Pressure Data bank (ISPD), and the International Surface Temperature Initiative (ISTI) databases.

  The delegates also expressed the need for the establishment of an additional database where all hydrometric DR&D efforts would be listed and updated by their sponsors or program managers. IEDRO will begin building this new database once funding is secured.

###
For more information about this topic, or to schedule an interview with Dr. Richard Crouthamel, please contact him directly at 410.867.1124 or e-mail him at r.crouthamel@iedro.org

Friday, January 25, 2013

Blacklisting

Things have gone a bit quiet of late I realize. In part this is due to real-life which has a habit of getting in the way. But in large part its because we have been grappling with the creation of a blacklist. 'We' here is the very definition of the royal we as it would be fairer to state that Jared has been grappling with this issue.

There be gremlins in the data decks constituting some of the input data to the databank algorithm - both dubious data and geolocation metadata. We knew this from the start but have stayed blacklisting until we got the algorithm doing sort of what we thought it should and everyone was happy with it. Now we have attacked the problem for several weeks. Here are the four strands of attack:

1. Placing a running F-test through the merged series to find jumps in variance. This found a handful of intra-source cases of craziness. We will delete these stations through blacklisting.

2. Running through NCDC's pairwise homogenization algorithm to see whether any really gigantic breaks in teh series are apparent. This found no such breaks (but rest assured there are breaks and the databank is a raw data holding and not a data product per se).

3. First difference series correlations with proximal neighbors. We looked for cases where correlation was high and distance was high, correlation was low and distance was low and correlation was perfect and distance low. These were then looked at manually. Many are longitude / latitude assignation errors. For example we know Dunedin on the South Island of New Zealand is in the Eastern Hemisphere:
This is Dunedin. Beautiful place ...

And not the Western Hemisphere:
This is not the Dunedin you were looking for ... Dunedin is not the new Atlantis

 But sadly two sources have the sign switched. The algorithm does not know where Dunedin is so is doing what it is supposed to. So, we need to tell it to ignore / correct the metadata for these sources so we don't end up with a phantom station.

There are other issues than simple sign errors in lat / lon that these picked up. One of the data decks has many of its French stations longitudes inflated by a factor of 10, so a station at 1.45 degrees East is wrongly placed at 14.5 degrees East. Pacific island stations appear to have recorded under multiple names and ids which confounds the merging in many cases.

4. As should be obvious from the above we also needed to look at stations proverbially 'in the drink', so we have pulled a high resolution land-sea mask and run through all stations against that. All cases demonstrably wet (greater than 10Km = .1 degree resolution at equator and many sources are only to 0.1 degree accuracy) are getting investigated.

Investigations have used the trusty googlemaps and wikipedia route in general with other approaches where helpful. Its time consuming and thankless. The good news is 'we' (Jared) are (is) nearly there.

The whole blacklist file will be one small text file the algorithm reads and one very large pdf that justifies each line in that text file. As people find other issues (and there undoubtedly will be - we will only catch worst / most obvious offenders even after several weeks on this) we can update and rerun.

Tuesday, January 15, 2013

First public talk on Databank Merge Results: AMS Annual Meeting

While there have been previous talks and posters about the International Surface Temperature Initiative, as well as the overall structure of the Global Land Surface Databank, last week marked one of the first times our group presented work on the merged product in a public fashion. I was given the opportunity to present at the 93rd Annual Meeting of the American Meteorological Society. The room was full of climatologists on the national and international scale, and we even gained a few contacts in hopes to receive more data for our databank effort.

In order to continue our aims to be open and transparent, the abstract from the conference can be found here, and the presentation used can be located here. The presentation was also recorded, and once AMS puts the audio online, we will also try and link to it.


Wednesday, January 9, 2013

How should one update global and regional estimates and maintain long-term homogeneity?

Prompted by recent discussions in various blogs and elsewhere (I'm writing this from a flaky airport connection on a laptop so no links - sorry) it seems that, for maybe the umpteenth time, there are questions about how the various current global and some national estimates are updated. Having worked in two organizations that take two very distinct approaches I thought it worth giving some perspective. It may also help inform how others who might come in and use the databank to create new products choose to approach the issue.

The fundamental issue of how to curate and update a global, regional or national product whilst maintaining homogeneity is a vexed one. Non-climatic artifacts are not the sole preserve of the historical portion of the station records. Still today stations move, instruments change, times of observation change etc. etc. often for very good and understandable reason (and often not ...). There is no obvious best way to deal with this issue. If ignored for long enough station, local and even regional series can become highly unrealistic if large very recent biases are not dealt with.

The problem is also intrinsically inter-linked with the question as to which period of the record we should adjust for non-climatic effects. Here, at least there is general agreement that adjustment should be made to match the most recent apparently homogeneous segment so that today's readings can be easily and readily compared to our estimates of past variability and change without performing mental gymnastics.

At one extreme of the set of approaches is the CRUTEM method. Here, real-time data updates are only made to a recent period (I think still just post-2000) and no explicit assessment of homogeneity is made at the monthly update granuality (there is QC applied). Rather adjustments and new pre-2000 data effectively are caught up with major releases or network updates (e.g. with entirely new station record additions / replacements / assessments normally associated with a version increment and manuscript). This ensures values prior to a recent decade or so remain static for most month to month updates but at a potential cost if a station inhomogeneity occurs in the recent past which is de facto unaccounted for. This can only then be caught up with through a substantive update.

At the other extreme is the approach undertaken in GHCN / USHCN. Here the entire network is reassessed based upon new data receipts every night using the automated homogenization algorithm. New modern periods of records can change the identification of recent breaks in stations that contribute to the network. Because the adjustments are time-invariant deltas applied to all points prior to an identified break the impact is to change values in the deep past to better match modern data. So, the addition of station data for Jan 2013 may change values estimated for Jan 1913 (or July 1913) because the algorithm now has enough data to find a break that occurred in 2009. This then may affect the nth significant figure of the national / global calculation in 1913 on a day to day basis. This is why with GHCNv3 a system of version control of v3.x.y.z.ddmmyyyy was introduced and each version archived. If you want bit replication to be possible of your analysis then explicitly reference the version you used.

What is the optimal solution? Perhaps this is a 'How long is a piece of string?' class of question. There are very obvious benefits to either approach or any number of others. In part it depends upon the intended uses of the product. If interested in serving homogeneous station series as well as aggregated area averaged series using your best knowledge as of today perhaps something closer to NCDC's approach. If interested mainly in large scale average determination and under a reasonable null that at least on a few years timescale the inevitable new systematic artifacts average out as gaussian over broad enough space scales the CRUTEM approach makes more sense. And that, perhaps, is fundamentally why they chose these different routes ...


Saturday, January 5, 2013

High School Students Engage in Climate Research

Please note that this is a guest post by Rich Kurtz, a teacher from Commack, NY state


A few years ago I had a student interested in climate change, my job as a science teacher was to work with the student to help her develop a project.  In a circuitous way my student and I were introduced to Mr. John Buchanan, the Climate Change Student Outreach Chairperson for the Casualty Actuarial Society.  Mr. Buchanan helped us develop a project using data from logbooks of weather from the 1700’s recorded by a Philadelphia farmer, Phineas Pemberton.  
Phineas Pemberton sample log page Jan. 1790, Philadelphia

My student was given the opportunity to present her data at the 3rd ACRE Workshop, Reanalysis and Applications conference in Baltimore, MD.  That meeting opened up the door to authentic learning opportunities for my students.  At the meeting I had the privilege of meeting scientists and educators from a broad spectrum of organizations.  Those professionals inspired me to investigate the possibility of introducing my students to the issues of climate change using historical weather data.   This has been a fruitful avenue of authentic learning experiences for my high school students.  With the help of outside mentors and ambitious and hardworking students we have been able to locate and use historical weather data for science research projects.  
Currently we are engaged in two projects.  One project involves digitizing data from weather records from logbooks recorded at Erasmus HallSchool in Brooklyn, NY between 1826 and 1849.  Cary Mock of the University of South Carolina told me about the logbooks, they are housed at the New York City Historical Society.  One of my students photographed the entire set of logbooks and is using those photos to digitize the data and explore and compare weather trends and changes.   
Erasmus High sample log entry from January 1852 (Brooklyn, New York)
Another project involves a group of students who have volunteered to digitize weather and lake height data from Mohonk Preserve in the New Paltz area of New York State.  After reading about a presentation about climate change given by the director of the preserve I contacted her and asked if there was anything that my students could volunteer to help with, with respect to weather data.  She was excited to get our students involved in digitizing their weather and lake water level records going back to the 1880s.  The students are currently putting the data from the logs into a database from with they will develop research questions from which they will formulate an investigation.   
Sample log entry from Mohonk Lake Preserve area (upstate New York), January 1890
I think that there is a lot of interest among teachers to get their students involved with authentic projects.  The advantage of working on historical weather projects is that it is an area of study that merges many aspects of learning.  A historical weather project can bring together topics in history, science, math and helps students with their organizational skills.  My students sometimes have the opportunity to consult with a professional scientist.  These areas all touch upon skills that we want our students to acquire.
I would like to acknowledge some of the people who have helped me with my work with students. Mr. John Buchanan, the Climate Change Student Outreach Chairperson for the Casualty Actuarial Society.  Mr. Eric Freeman, from the National Climactic Data Center, Mr. Gilbert Compo, from the Climate Diagnostics Center NOAA and Cary Mock of the Department of Geography, University of South Carolina.

Wednesday, January 2, 2013

Databank update - nearby 'duplicates' issue raised by Nick Stokes

Climate blogger Nick Stokes provided some additional feedback upon the beta 2 release alerting us to a case whereby two records for a station were still present. This was not a bug per se. The station data in one of the data decks presented to the merge program had been adjusted and hence the data disagreed. So, the merge program was doing what it should. Based upon a combination of metadata and data agreement the probability the two records were distinct was sufficiently large to constitute a new station.

One of the issues arising from the historically fragmented way data has been held and managed is that many versions of the same station may exist across multiple holdings. Often the holding will itself be a consolidation of multiple other sources and, like a Russian doll - well, you get the picture - its a mess. So, in many cases we have little idea what has been done to the data between the original measurement and our receipt. These decks are given low priority in the merge process but ignoring them entirely would be akin to cutting one's nose off to spite one's face - they may well contain unique information.

To investigate this further and more globally we ran a variant of the code with only one line change (Jared will attest that my estimate of line changes are always an underestimate but in this case it really was one line). If the metadata and data disagreed strongly then we withheld the station. We then ran a diff on the output with and without. The check found solely stations that were likely bona fide duplicates (641 in all). This additional check will be enacted in the version 1 release (and hence there will be 641 fewer stations).

Are we there now? Not quite. We have still to do the blacklisting. This is labor-intensive stuff. We will have a post on this - what we are doing and how we are planning to document the decisions in a transparent manner - early next week time permitting.

We currently expect to release version 1 no sooner than February. But it will be better for the feedback we have received and the extra effort is worth it for a more robust set of holdings.

Tuesday, December 18, 2012

So what changed between beta1 and beta2?

Even though we documented changes from the beta1 release to beta2, did we actually change the overall results of the databank? Well, there was a noticeable drop of stations over time, especially over the past 50 years:
 
However this does not mean that we are losing important stations. It was discovered through Nick Stokes’ blog that there may have been duplicates within the beta1 release. After some analysis, we tweaked the algorithm to remove these duplicates. Because of this we have lost the station count, however we are still seeing many more stations than the current operational product of GHCN-M version 3. In the end however, addressing these changes from beta1 to beta2 did not make a major difference on the annual global anomalies.

 
We are still in beta, however we are pushing forward for a version 1.0.0 release soon!

Monday, December 10, 2012

Where do differences between the databank and GHCNv3 arise?

If you were paying attention in an earlier post on characterizing the first version beta release you will have noted that the databank timeseries behavior is subtly different to that of the 'raw' GHCNv3.

The early period record is slightly cooler than the estimates from GHCNv3 while the last decade is warmer than GHCNv3. The net impact is to increase the apparent trend. This pattern is present in all the merge variants to a greater or lesser degree. This raises the logical question as to why this difference is arising. Is it because the databank's improved number of stations are sampling areas of the globe previously unsampled in GHCNv3 which behaved in a different manner to the restricted GHCNv3 sample from this larger whole or is it down to additional station sampling in areas already sampled by GHCNv3? And if so why? The two graphs below do the obvious thing and split it out simply by averaging over grids present in both and those only in the databank (there is a much smaller population of gridboxes present in v3 but not in the databank which would be grossly too small to have a significant material impact on global estimates being considered here).

With GHCNv3 gridbox sampling (concentrate on (spot the?) difference between red and blue)

New gridboxes.

So, most of the difference appears to relect better sampling regions already sampled. The question of why and what impact it has on homogenization efforts is 'future work' ... and is why we now need multiple groups to take up the challenge of creating new data products from the databank.

Thursday, December 6, 2012

Databank Release: Beta #2

Today, we have released our second beta version of the global land surface databank. This update includes some changes that were made in response to comments on this very blog, along with a few minor tweaks.

The beta2 release can be found here: ftp://ftp.ncdc.noaa.gov/pub/data/globaldatabank/monthly/stage3/. Within that directory one can find all the data and code used, along with some graphics depicting the results of all the merge variants. A technical description of the merge program (similar to beta1) is also provided, along with a new file documenting changes from beta1 to beta2.

Beta1 is not forgotten and lost forever. All the data and code from beta1 is located in our archive if anyone still wishes to access it: ftp://ftp.ncdc.noaa.gov/pub/data/globaldatabank/archive/monthly/stage3/beta1/

Some of the major changes include the following:
  • Added a metadata comparison check of when the data record began
  • Added source data from Sweden, Uruguay, Norway, Canada, and the MetOffice's new HadISD dataset
  • Updated lookup table to determine whether a candidate station is merged, unique, or withheld after a data comparison is made
The original merging methodology can be found here, as well as a description of the changes from beta1 to beta 2 here.

The deadline has passed for new data to be added for an official version 1 release. However there is still plenty of time to provide feedback on all the methodologies used in constructing the databank. Your comments have helped us so far, and we welcome any more that may arise.

Tuesday, November 6, 2012

Taking the temperature of the Earth: Temperature Variability and Change across all Domains of Earth's Surface

There is a session of the same title as this blog post being organized by collaegues in the Earthtemp initiative www.earthtemp.net at next year's EGU meeting. The session details from the EGU meeting website are:

The overarching motivation for this session is the need for better understanding of in-situ measurements and satellite observations to quantify surface temperature (ST). The term "surface temperature" encompasses several distinct temperatures that differently characterize even a single place and time on Earth’s surface, as well as encompassing different domains of Earth’s surface (surface air, sea, land, lakes and ice). Different surface temperatures play inter-connected yet distinct roles in the Earth’s surface system, and are observed with different complementary techniques.

There is a clear need and appetite to improve the interaction of scientists across the in-situ/satellite 'divide' and across all domains of Earth's surface. This will accelerate progress in improving the quality of individual observations and the mutual exploitation of different observing systems over a range of applications.

This session invites oral and poster contributions that emphasize sharing knowledge and make connections across different domains and sub-disciplines. They can include, but are not limited to, topics like:

* How to improve remote sensing of ST in different environments

* Challenges from changes of in-situ observing networks over time

* Current understanding of how different types of ST inter-­relate

* Nature of errors and uncertainties in ST observations

* Mutual/integrated quality control between satellite and in-situ observing systems.

If you are interested in attending abstracts need to be submitted by Jan 9th 2013.

More info can be found at http://meetingorganizer.copernicus.org/EGU2013/session/12115

We will run a guest post by the Earthtemp organizers in the coming weeks outlining what their effort involves and how it is synergistic with the International Surface Temperature Initiative. Watch this space ...

Friday, October 26, 2012

Databank poster at Global Framework for Climate Services User Conference

There is a meeting happening this week in Geneva in preparation for an Extraordinary Meeting of the World Meteorological Organization Congress. The meeting details can be found here. A link to a local low-resolution (still 3Mb for those on slow connections) version of the poster can be found here. The poster outlines progress to date and highlights that there is much that remains to be done. Given that many of the great and the good of the meteorological world are in attendance including delegations from most National Meteorological Services it is hoped that this poster can raise awareness of the databank and help gain access to additional data and promote additional data rescue efforts. That said, nothing is ever likely to change overnight ...

Thursday, October 18, 2012

How do you decide if a station is to be merged, added as unique or withheld?


The above flowchart is a simple visualization on how the merge program works. As you can see there are a number of different options the candidate station can go through. I'm confident enough to say that each and every situation above happens at least once in the recommended merge!

Let's break down this flowchart, starting with the metadata check. The candidate station runs through all the target stations and calculates three metrics:
  • distance probability
  • height probability
  • station name similarity using Jaccard Index
These probabilities range from 0-1, where 0 means no station match and 1 means perfect station match. Using a quasi-Bayesian approach, these three metrics are combined to form a posterior probability of station match (again, between 0 and 1). This is known as the metadata probability. The metadata probability is calculated between the candidate station and all target stations.

Using a threshold of 0.50 we then see what the next step is. If no metadata probability values exceed this threshold, then we check the validity of the individual metadata metric. If it turns out that 2 metrics are really good (> 0.90) and the third one is terrible, we then determine that there is bad or incomplete metadata, and the station is withheld. Otherwise we are confident that the station is unique in its own right and we add it to the target dataset.

If any stations exceed the threshold of 0.50, then we move down the left side of the chart. The next step is data comparisons. Using an overlap of no less than 5 years, we calculate the Index of Agreement, which is a "goodness-of-fit" measure similar to the coefficient of determination, however not as sensitive to outliers. Similar to the metadata probability, this is calculated between the candidate station and all target stations with metadata probability values greater than 0.50.

We then check to see if any comparisons were made. If not, then that means the two stations did not have any overlap period, or it had some overlap, but it didn't exceed the 5 year threshold. At this point one of two different things can happen. We look at the target station with the highest metadata probability. First, if the best probability is greater than 0.85, then the station merges. If not, then it is withheld.

If a data comparison was made via the Index of Agreement, then a lookup table takes into account both IA and the overlap period and creates a probability of station match, as well as station uniqueness. These are then recombined with the metadata probability to form a posterior probability of station "sameness" and station "uniqueness". If any one of these probabilities pass the same threshold, then the candidate station merges with that target station. If no same probabilities pass the same threshold, but a unique probability passes the unique threshold, then the candidate station is unique. Otherwise, the station is withheld.

A more detailed description of the above flowchart can be found here.

Tuesday, October 16, 2012

How do I work out where a station series in the merged product originates?

The above image is an example station from Logan International Airport in Boston, Massachusetts, USA. There were three different sources that went into this merged station. For every temperature value in the merged product, there is a corresponding number. That number represents the spot in the source hierarchy used to merge the stations. Using that number, one can find the station source.

Using the above image, it can be found that the sources belong to GHCN-Daily (source #01, black), russsource (source # 35, red), and ghcnmv2 (source #39, blue). Now that the sources are known, one can find the Stage 2 data for this station. A user can also look further back, and find the original digitized copy (Stage 1), and sometimes even the original paper copy (Stage 0).

Wednesday, October 10, 2012

Where is the databank merge code? How can I make it work?

The merge code was written in FORTRAN 95 and is located within each variants directory. For example, if one were to find the code for the recommended merge, the location is here:

ftp://ftp.ncdc.noaa.gov/pub/data/globaldatabank/monthly/stage3/recommended/code/

Once uncompressed, there are four files that are required for the program to run correctly. The program will fail if any one of these files are missing. A description of each file is below:

databank_sources.txt: This is the prioritized list of sources that go into the merge program. This file tells the user the name of the source, number of stations, whether it was originally a monthly or daily source, and whether it includes TMAX, TMIN, or TAVG temperature. In order to acquire the source data, one is required to grab the data from the databank monthly stage 2 FTP site.

lookup_IA.txt: This is the lookup table the program reads in to determine the probability of station match and station uniqueness.

merge_module.f95: This is a module the main program calls to when performing certain functions. This was done so simple procedures called multiple of times were only written once. In addition, this provides the user the opportunity to write in their own code and compare results.

merge_main.f95: This is the main program. The first section, named "User Defined Thresholds," is where the user can define directory structures and performance thresholds.

A more description about these files, along with justification, can be found in the merging methodology document. A compiler is required to run the program. There are many different FORTRAN compilers, however the code was written so that it can comply with the g95 compiler, which is free and available to the public here.

Once a compiler (such as g95) is installed, simply type in the following command:

g95 merge_module.f95 merge_main.f95

And you should be good to go! Although not required, the user is strongly encouraged to tweak any of the thresholds and/or priority list in order to achieve different results. 

If here are any questions, feel free to send an e-mail to data.submission@surfacetemperatures.org, or simply comment on this post

Tuesday, October 9, 2012

Why are there several variants of the databank merge?

Historically the storage, sharing and rescue of land meteorological data holdings has been incredibly fractured in nature. Different groups and entities at different times have undertaken collections in different ways, often using different identifiers, station names, station locations (and precision) and averaging techniques. Hence the same station may well exist in several of the constituent Stage 2 data decks but with subtely (or not so) different geo-location or data characteristics.

Neither an analyst nor an automated procedure will make the right call 100% of the time. However, an automated procedure does allow us to spin off some plausible alternatives. By spinning off such alternatives we can allow subsequent teams of analysts looking at creating quality controlled and homogenized products to assess the uncertainty in their results to these choices. The alternative is to ignore such uncertainty and yet it clearly will have some bearing on the final data products where errors at this stage (merging when unique, deeming unique when the same record) will affect the final results.

Several members of the Working Group suggested different merge priorities sampling the choice of source decks and their ordering as well as the parameter choices within the code itself. From the methodology summary:

Variant One (colin)
In this variant, the source deck is shifted to prioritize sources that originated from their respective National Meteorological Agencies (NMA’s). This way, the most up to date locally compiled data is favored over consolidated repositories, which may or may not be up to date. In addition, sources that are either raw or quality controlled are favored over homogenized sources.

Variant Two (david)
Here, NMA’s are favored, having TMAX, TMIN, and comprehensive metadata as the highest priority. The overlap threshold is lowered from 60 months to 24 months, in order for more data comparisons to be made.

Variant Three (peter)
The source deck is changed under the following considerations. No TAVG source (or data from mixed sources) is ingested into the merge. This is because there is uncertainty in the calculation of TAVG (ie, it is not always TMAX+TMIN/2). TAVG in the final product is only generated from its respective TMAX and TMIN value. For the remaining sources, GHCN-D is the highest priority, and the rest are ranked by order of longest station record present within the source deck, from longest to shortest. The metadata equation is changed to give weighting to the distance probability (10) over the height (1) and Jaccard (1) probabilities (default is 9, 1, and 5, respectively). Finally the thresholds to merge and unique the station are lowered and favored to merge more stations.

Variant Four (jay)
Within the algorithm, the data comparison test results in three distinct possibilities. The station is merged, unique, or withheld. In this variant, this is altered so the candidate station is either merged or unique.

Variant Five (matt)
All homogenized sources are removed. Nothing else is altered compared to the recommended merge.

Variant Six (more-unique)
Thresholds are adjusted to make more candidate stations unique, thus increasing the overall station count.

Variant Seven (more-merged)
Thresholds are adjusted to make more candidate stations merge with target stations, thus decreasing the overall station count.

These have a substantive impact on several aspects of behavior. Most notably:

Station count
Gridbox coverage
Timeseries behavior
The outlier in each is the 'Peter' variant (yep, that is me) and results from the fact that early records have very few max / min measurements as currently archived. The lower anomaly early in this variant is a result of sampling and not a reflection of fundamental discrepancies. If we sub-sample the other variants to the same very restricted geographic sample they fall back into agreement.

This reflects the very real importance of doing data rescue. We know there are as many data pre-1960 in image / hardcopy only as have been digitized. This will be returned to at a later date.

Of course, if you don't like these variants or just want a play you can create your very own variant simply by downloading and using the code that has been made available alongside the beta release.


Friday, October 5, 2012

Is it too late to submit data for inclusion in the databank?


Short answer: No

Slightly longer answer: We are still accepting data submissions for inclusion in the first version release until November 30th. At that point we shall provide an updated beta release version with any new data sources that have been received. Even then, there is no end-point for submissions that can be included in subsequent version releases. There is also no point at which we are likely to have ‘too much’ data so any data is useful.

More detail:

Data submissions can range from a single station to large consolidated holdings. Because the merge program attempts to discriminate between different sources, so long as sufficiently accurate geo-location metadata are provided (latitude, longitude, station name and elevation) it should be able to cope with a degree of information redundancy. It is therefore not necessary to ascertain first whether a version of each candidate station record already exists. Particularly if the submission has greater provenance (a link to the original in hard copy / image form, better station metadata including a history of observing practices and instrument changes etc.) it will likely be given priority.  So, do not worry as to whether the data already exists in the Stage 2 holdings unless it is simply a duplicate resubmission of a pre-existing holding (obviously).

If you need help in negotiating release of data to the databank there exist a boilerplate letter of support and a certificate of appreciation (the latter on request). Further, case specific, help can be provided by Databank Working Group members upon request.

Once you have the data we have tried to make its submission as easy as possible. There are submission guidelines which provide the details of what data is required and how to submit. We do not require that data be converted from whatever the native digital format is, in fact we prefer you not to as this may yield errors that are undetectable.  You do, however, need to describe the format sufficiently that a conversion script can be written to convert it to stage 2.

Although the first Stage 3 merged release consists of solely monthly resolution temperature data we strongly encourage submission of data on timescales at one or more of sub-daily, daily and monthly resolution and for multiple meteorological elements and not just temperatures. It is hoped that future releases will include such shorter timescales and additional meteorological elements to just temperature. These will be useful for many scientists and end-users beyond the more restricted aims of the International Surface Temperature Initiative.

Good luck and thanks

Thursday, October 4, 2012

What known issues remain to be addressed with the databank during beta release?

      First and foremost, this beta release affords the opportunity for broader community input to the databank process. Having many eyes on the prize, hands turning over the rocks and boots kicking the tires will make this thing better.  So, there will undoubtedly be a number of issues in addition to those highlighted here that will arise.  We welcome such feedback. There are a number of issues which we know we will address during beta:
  1. Where we have daily sources we will append provenance flags which specify how many daily reports went into each monthly value. This may prove useful to analysts down the line. Where we only have monthlies we will append this flag as a missing value indicator
  2. We will create a version which re-injects the element-wise provenance flags from the constituent stage 2 (source deck) holdings into stage 3 (merged) holdings. For computational efficiency it is impossible to carry the flags through the merge program, but, obviously, information is available to do this as post-processing.
  3. We are well aware that some stations will have poor geo-location metadata (i.e. Spanish stations in the Sahara or older station segments using a different meridian to Greenwich). At present no blacklisting is applied. But we will definitely apply such blacklisting to the first version merge. We are still in the process of collating a list of known geo-location errors to apply such a fix. One of two things will be done: a correction to the geo-location data where this is known and generally accepted; or force the code to withhold the station from the merge. If you find an apparent issue with a station’s location please let us know either through the blog or data.submission@surfacetemperatures.org so that we can investigate and determine what to do.
  4. We plan to release all the stage 1 to stage 2 conversion scripts for completeness. This will be done soon. There are only so many hours in the day and getting the merge in order has been the priority.
  5. We plan to create several output formats to aid usability. These are hoped to include cf compliant netcdf. For now the databank is made available in two ASCII-based formats.
  6. Instigation of a consistent station identifier system that is robust to future data additions and deletions and is consistent with daily identifiers moving forwards.

Beta release of first version of global land surface databank


Today marks the release of the first beta version of the global land surface databank constructed under the auspices of the International Surface Temperature Initiative’s Databank Working Group. The release is of monthly average temperatures from stations around the globe that have been made available without restriction.

The release will be in beta for a period of 3 months before an official first version release. It is hoped that during this time users can take a look and provide feedback (preferably through the Initiative blog) and advice to ensure that the first version release is of the highest possible quality. Additional data submissions received prior to November 30th will be incorporated in the first version release.

The release consists of:
·      Over 40 distinct source decks (compilations / holdings) submitted to the databank to date in Stage 0 (hardcopy / image; where available), Stage 1 (native digital format), and Stage 2 (converted to common format and with provenance flags).
·      A recommended merged product and several variants thereon which have all been built off the stage 2 holdings
·      All code used to process the data merge
·      Documentation necessary to understand at a high level the processing of the data

The release is available from ftp://ftp.ncdc.noaa.gov/pub/data/globaldatabank/.  The merged product can be found at ftp://ftp.ncdc.noaa.gov/pub/data/globaldatabank/monthly/stage3/ . The recommended merge consists of over 39 thousand stations, which range in length from a few years to over two Centuries.


This is data that mostly has not been quality controlled or bias corrected. It is important to stress that it therefore does not constitute a climate data record / dataset suitable for monitoring long-term changes. Rather, it provides a basis from which research groups can create algorithms to produce climate datasets. The results from these algorithms can then be compared and benchmarked as part of the International Surface Temperature Initiative activities. We hope that many groups and individuals take up this challenge which will lead to improved understanding of land surface air temperature changes particularly at regional scales.

This release is the culmination of two years effort by an international group of scientists to produce a truly comprehensive, open and transparent set of fundamental monthly data holdings. In the coming weeks a number of additional postings to the blog will attempt to explain different aspects of this databank.

More information on the Initiative and how to get involved can be found at www.surfacetemperatures.org .

Wednesday, September 26, 2012

On the importance of metadata ...

If you are reading this then you undoubtedly will know that much contention arises over the siting of stations, particularly over the United States where such effects have been documented for the USHCN subset of the COOP network through the citizen science www.surfacestations.org effort. This, and available modern station inventories, shows that most of the network now consists of MMTS sensors (the things that look like the heads of Dalek's in Dr. Who or stacked UFOs) rather than the Cotton Region Shelters (Stevenson Screens) which are white painted wooden ventilated boxes that were used to house liquid in glass thermometers for the majority of the record. As an aside, very early in the record for the US prior to the early twentieth Century, as elsewhere, a large number of approaches were used.

Given that:
  • We know there must have been a change occur between Cotton Region Shelters and MMTS for all USHCN stations that are currently MMTS instrumented.
  • The MMTS has a short electrical lead that will more often than not have involved a relocation of the instrument closer to a power source (building) with lower quality siting characteristics.
  • The MMTS has different measurement characteristics (a tendancy to under-estimate daily maxima and over-estimate daily minima compared to Cotton Region Shelter instrumentation) verified by several side-by-side comparisons, some over several decades.
It is of interest to ask for what period of time the modern station configurations may have been 'representative' i.e. when such sites likely changed location and / or instrument. Both the very likely change in physical measurement location and the very certain change in instrument characteristics will be important considerations in the continuity of the station records and they clearly cannot be divorced from one another on a site-by-site basis. 

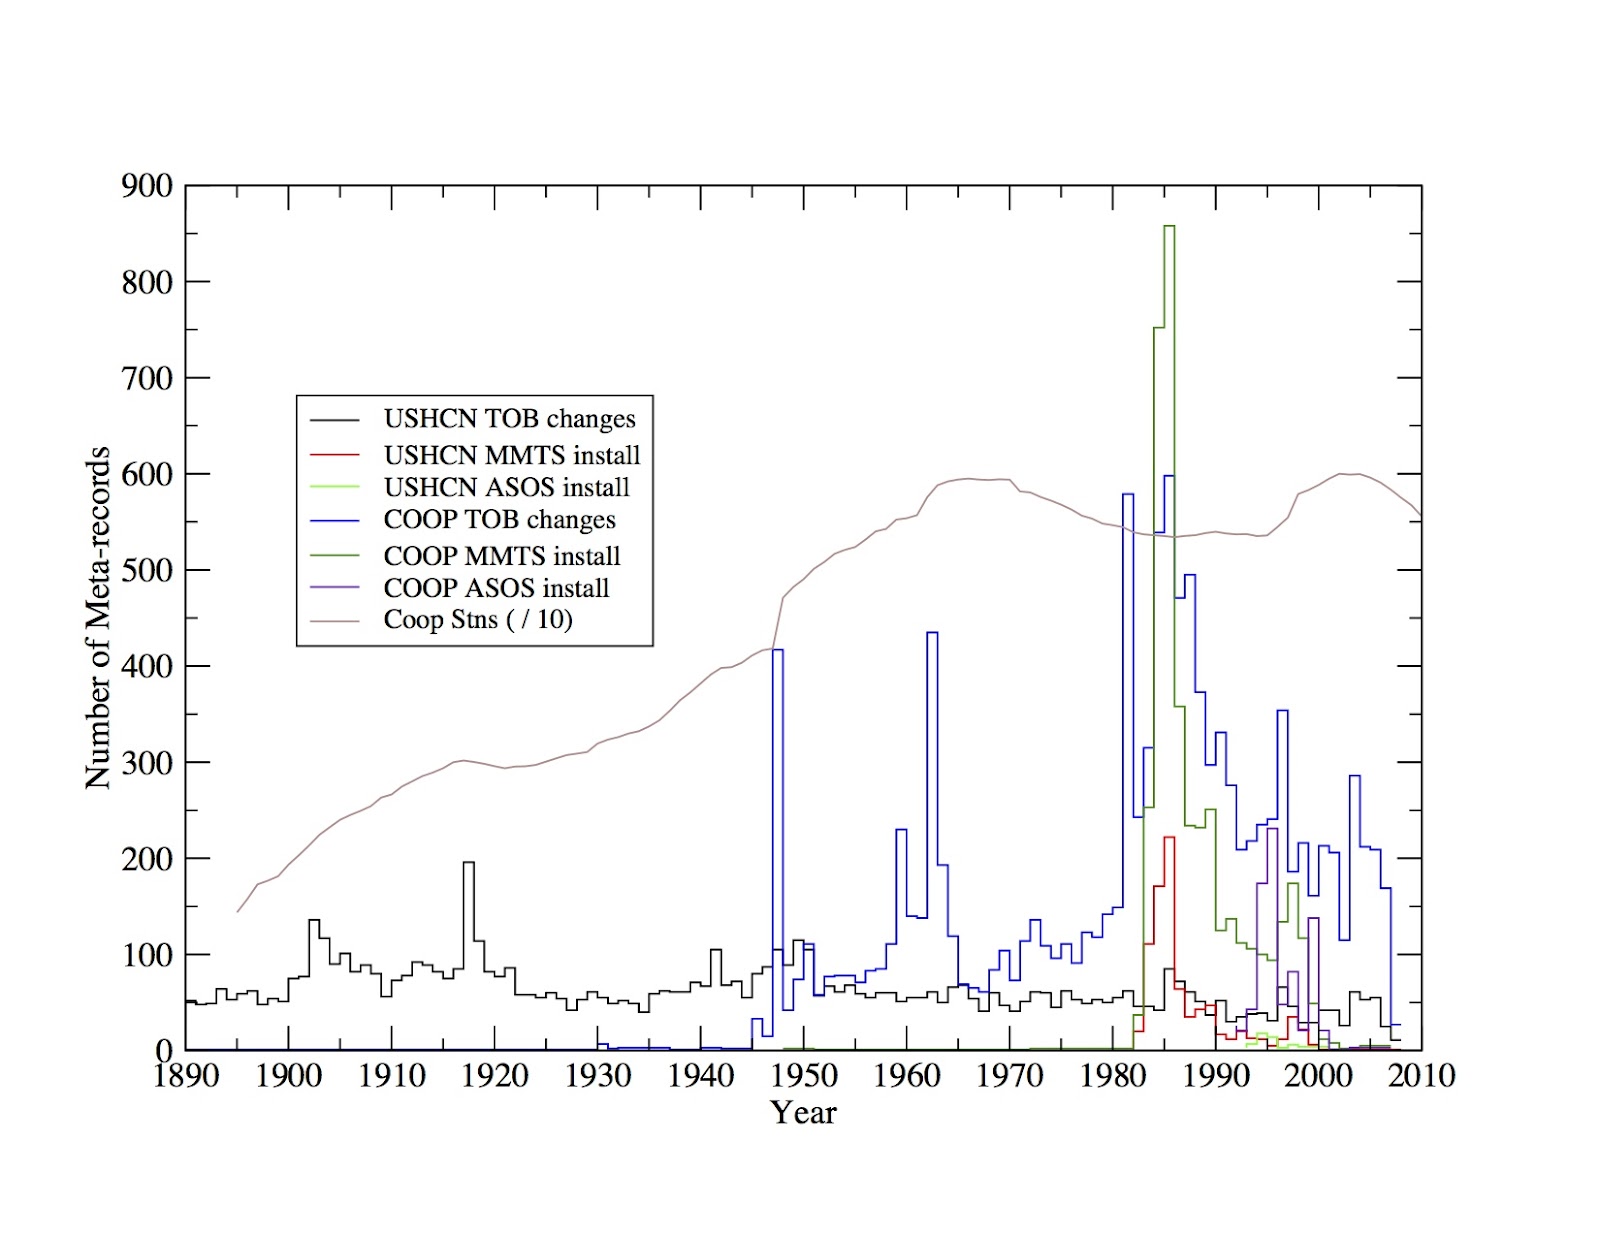
Fortunately, for the US we have good, although not complete, metadata. Based upon this its possible to break down when important aspects such as instrument changes, changes in time of observation and other considerations occured both for the USHCN subset and the larger COOP network (although the metadata for the remainder of the COOP is somewhat poorer prior to the mid-twentieth Century). This is shown below (courtesy Claude Williams, NCDC):

Timeseries of frequency of metadata event types for a subset of metadata classes across both USHCN and the broader COOP network. For completeness ASOS is described here 

So, from the above figure its obvious that MMTS transition started in 1982, with the bulk of the transition both in the USHCN and COOP occuring between then and 1990, but some substantial number of such replacements occuring through at least 2000 (some of these may have been replacements of previously installed MMTS sensors). So, how far back can one imply anything from the modern siting of currently MMTS stations? At the earliest 1982 when the replacement program began, and possibly no further back than the early 2000s for some stations. Beyond that careful forensics on a site-by-site basis would be required to ascertain whether the MMTS transition necessitated a change in measurement location. If it did then modern siting would have no bearing on the pre-MMTS segment of the record. Given that the metadata records generally the most significant change it may be rare that the metadata record itself notes whether a change in measurement location was associated with the (more substantial) change in instrumentation.

Bottom line: We need to know not just what the site looks like now but how it has changed over its history if we are to properly assess potential issues of representivity and homogeneity. Current siting tells us about today's measurements, not about yesterday's measurements (or for that matter tomorrows and MMTS has itself now started to be replaced by a newer - although similar - instrument) ... so we need contiguous metadata and not simply snapshots (although they are a valuable start, don't get me wrong) if we are to properly interpret records. Of course outside the US its rare to have access to more than lat, lon, elevation and name, which doesn't mean to say it doesn't exist, rather its not been shared and certainly not in a common format that is machine readable, but that is another post for another time ...