Update 4/26: The googledocs share spreadsheet linked below has been updated and simplified which will hopefully make this easier for people to engage in. There are also plans to host these images online soon and hopefully allow anyone interested to digitize and submit the digitized records for inclusion in the data holdings.
Colleagues at NCDC have recently embarked on a project of truly epic proportions. To inventory, image as necessary, and eventually digitize (to the extent useful unique information exists in them) the large volume of international holdings (>2000 boxes) held in hard copy in the NCDC basement. That is a lot (an awful lot) of boxes ...
Colleagues at NCDC have recently embarked on a project of truly epic proportions. To inventory, image as necessary, and eventually digitize (to the extent useful unique information exists in them) the large volume of international holdings (>2000 boxes) held in hard copy in the NCDC basement. That is a lot (an awful lot) of boxes ...
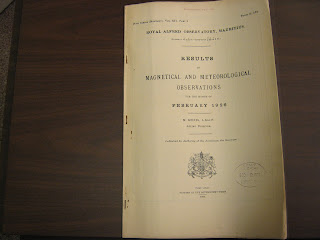
These consist of a huge range of different, primarily land in-situ, meteorological holdings. Some may be unique, others may exist elsewhere already as images or have been digitized already. Below are just a couple of teaser images ...
We would value yours and others' collective help in prioritizing the imaging and digitization of these holdings, telling us what has already been done and in actually doing some of the work.
So, with that ...
An editable form of the current version of the spreadsheet summary with about 15% inventoried (Africa and S. America largely) and 1% imaged (highlighted yellow) is available at:
Please direct edit this, I do not want to have to manage 50 versions of the same spreadsheet or merge them ...! Alternatively you can leave a comment below if you are more comfortable doing that.
Edits can request further forensics (which stations, when, what), give reasons for interest in the data, offer to digitize images from that set of data etc. etc.
In terms of next steps, in coming weeks the land data images taken will very likely start to be hosted on the International Surface Temperature Initiative databank ftp site at NCDC in appropriate stage 0 (raw data imagery) directories. Then, ideally, we will get some help in digitizing these at which point we can start to make the digital data available without restriction through that databank portal and pull it through to NCDC's products as well as allowing others to use and investigate it. This will potentially help us fill in significant gaps in our knowledge of climate change in many regions and periods.
If there is significant interest I will update the spreadsheet with new inventories of boxes periodically.
Some resources which might help in this task should you wish to partake in it:
http://docs.lib.noaa.gov/
http://badc.nerc.ac.uk/browse/
ftp://ftp.ncdc.noaa.gov/pub/
ftp://ftp.ncdc.noaa.gov/pub/
More on the databank effort, including submission guidance for digital holdings that may not already be there, can be found at http://www.surfacetemperatures.org/databank . We are close to releasing a first version of the databank, but it is not too late to receive data submissions for consideration in the first version ...
Many thanks in advance for any help received in this task.


